
The goal of shinipsumis to provide random shiny elements for easiest shiny app prototyping, so that you can focus on building the frontend before building the backend.
The full documentation can be found on the pkgdownsite: https://thinkr-open.github.io/shinipsum/
Installation
You can install the dev version of shinipsum from GitHub with:
install.packages("shinipsum")About
You’re reading the doc about version : 0.0.0.9000
This README has been compiled on the
Sys.time()
#> [1] "2023-03-27 11:19:38 CEST"
Here are the test & coverage results :
devtools::check(quiet = TRUE)
#> ══ Documenting ═════════════════════════════════════════════════════════════════
#> ℹ Installed roxygen2 version (7.2.3) doesn't match required (7.1.1)
#> ✖ `check()` will not re-document this package
#> ── R CMD check results ─────────────────────────────── shinipsum 0.0.0.9000 ────
#> Duration: 18.4s
#>
#> ❯ checking top-level files ... NOTE
#>   Non-standard file/directory found at top level:
#>     ‘README.html’
#>
#> ❯ checking dependencies in R code ... NOTE
#>   Namespace in Imports field not imported from: ‘utils’
#>     All declared Imports should be used.
#>
#> 0 errors ✔ | 0 warnings ✔ | 2 notes ✖
covr::package_coverage()
#> shinipsum Coverage: 97.91%
#> R/example.R: 44.44%
#> R/Table.R: 96.97%
#> R/Plot.R: 99.29%
#> R/DataTable.R: 100.00%
#> R/dygraphs.R: 100.00%
#> R/Image.R: 100.00%
#> R/LinearModel.R: 100.00%
#> R/Print.R: 100.00%
#> R/Text.R: 100.00%
#> R/utils.R: 100.00%
Demo
Available examples:
library(shinipsum)
ipsum_examples()
#> [1] "01_navbar.R"
You can run shinipsum demos with:
shiny::runApp(
  ipsum_examples("01_navbar.R")
)
Available ipsums :
Note: {shinipsum} only load functions which are necessary to its internal job. If you want to customise an output or to use a renderXX / XXOutput, you’ll need to explicitely load the packages needed (for example, if you want to customise a dygraph, a ggplot, or use ggplotly).
DataTable
random_DT takes 4 args :
-
nrow&ncol: number of row and columns of the table -
type: random, numeric, character, numchar - the type of the columns -
...: args to be passed toDT::datatable
Plot
random_ggplot takes one arg :
-
type: Can be any of “random”, “point”, “bar”, “boxplot”,“col”, “tile”, “line”, “bin2d”, “contour”, “density”, “density_2d”, “dotplot”, “hex”, “freqpoly”, “histogram”, “ribbon”, “raster”, “tile”, “violin” and defines the geom of the ggplot. Default is “random”, and chooses a random geom for you.
Default theme is minimal.
As the return object is a ggplot, it can be enhanced like any other ggplot with +.
library(ggplot2)
random_ggplot(type = "col") +
  labs(title = "Random plot") +
  theme_bw()
random_ggplotly calls the ggplotly function on a random_ggplot.
Dygraph
random_dygraph returns a random dygprah. It takes one arg:
-
...: arguments which are passed to thedygraph()function.
As the return object is a dygraph, it can be enhanced like any other dygraph.
random_print takes one arg:
-
type: can be any of"character", "numeric", "model", "table", and defines the type of print. Default is"character".
Example
Here is an example of using shinipsum to generate a random app:
library(shiny)
library(shinipsum)
library(DT)
ui <- fluidPage(
  h2("A Random DT"),
  DTOutput("data_table"),
  h2("A Random Image"),
  plotOutput("image", height = "300px"),
  h2("A Random Plot"),
  plotOutput("plot"),
  h2("A Random Print"),
  verbatimTextOutput("print"),
  h2("A Random Table"),
  tableOutput("table"),
  h2("A Random Text"),
  tableOutput("text")
)

server <- function(input, output, session) {
  output$data_table <- DT::renderDT({
    random_DT(10, 5)
  })
  output$image <- renderImage({
    random_image()
  })
  output$plot <- renderPlot({
    random_ggplot()
  })
  output$print <- renderPrint({
    random_print("model")
  })
  output$table <- renderTable({
    random_table(10, 5)
  })
  output$text <- renderText({
    random_text(nwords = 50)
  })
}
shinyApp(ui, server)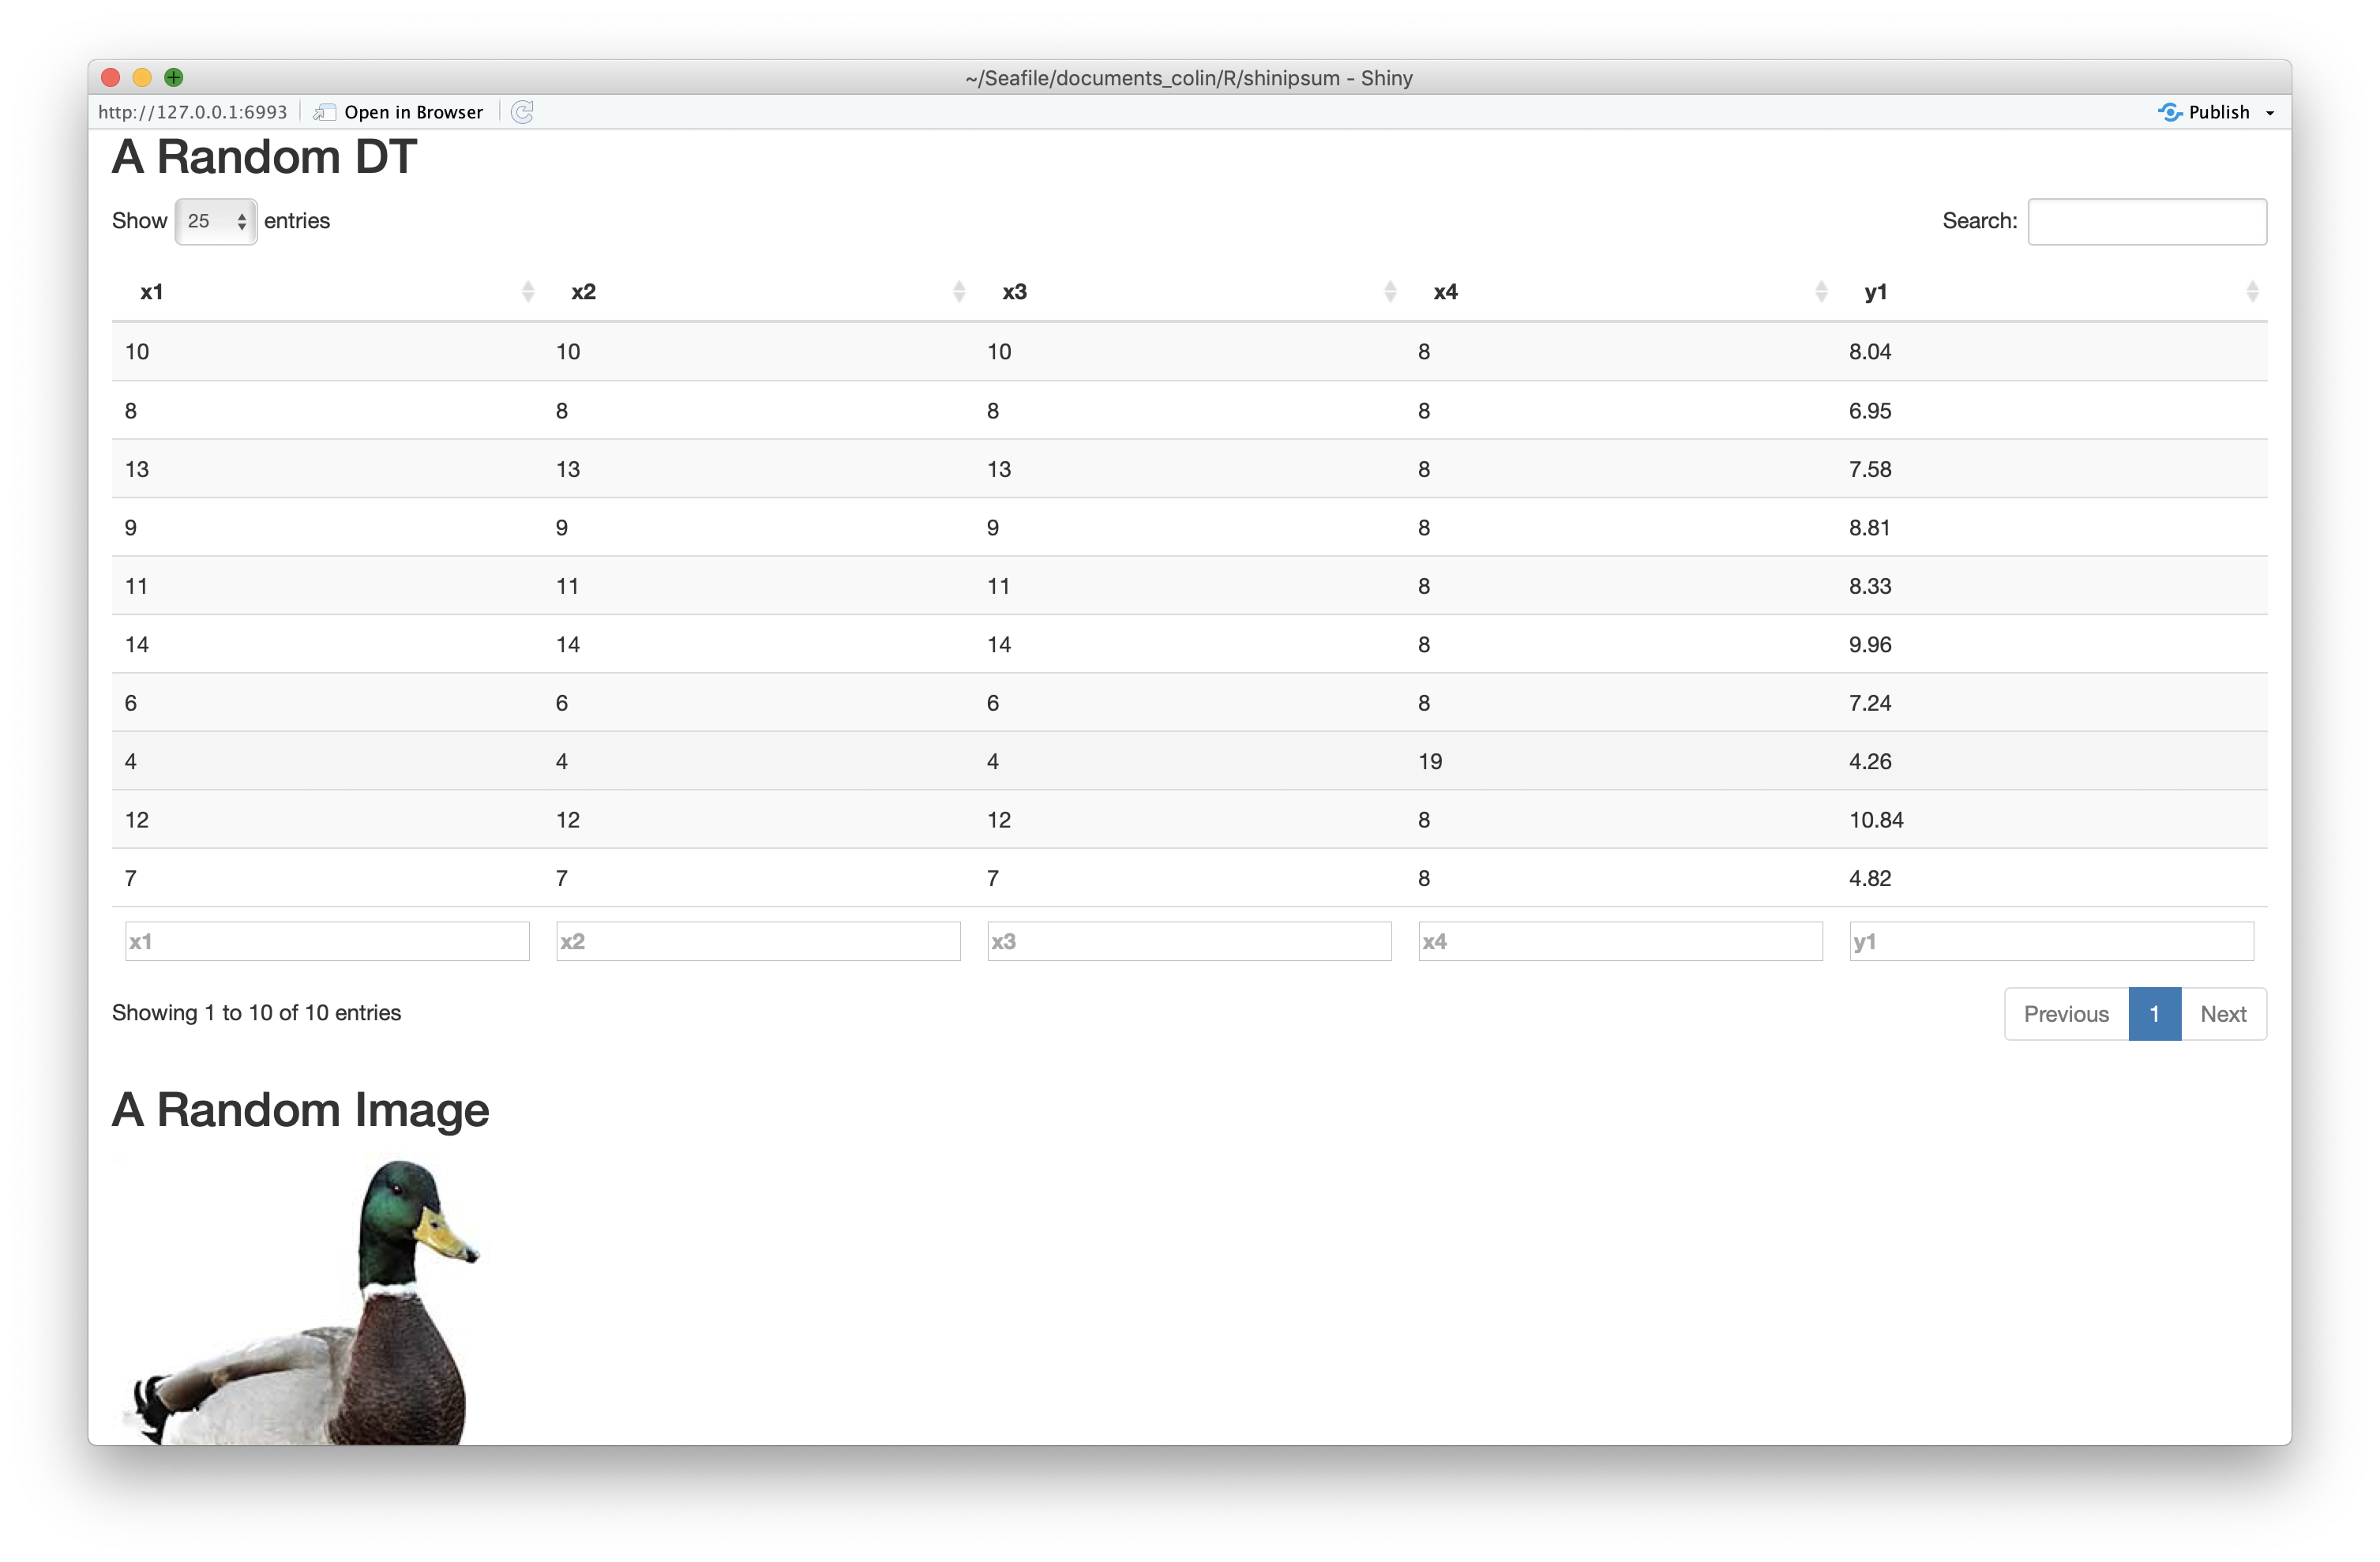
Please note that the ‘shinipsum’ project is released with a Contributor Code of Conduct. By contributing to this project, you agree to abide by its terms.